
Introducing the Goalkeeper Value Model (GVM)
Creating an actionable Goalkeeper Value Model that can be used in performance analysis + set piece analysis

I am a very chaotic person by nature, and I need structure to make sure everything works right. This makes me thrive. But when the structure isn’t good enough, it happens that projects stay on the shelf for a long time. One of these projects was the Goalkeeper Value Model (GVM), but not anymore! I finished it and I’m very happy with it.
I’ve often said that goalkeeper data is not as available in mainstream data sources and providers. That’s one part of the story actually. Goalkeeping is harder to measure in on-ball data because a lot happens that is technical or part of how a defender sets up. Another reason for this phenomena is that media is focused on how goals are scored and not necessarily on how goals are prevented. And, I made it my mission to change that. Okay, that’s very idealistic. I want to play my part in creating understanding for goalkeeping data.
Contents
Introduction
Data collection, manipulation and explainer
Aim
Theory
Methodology
Final product
Analysis
Final thoughts
Introduction
Goalkeepers are underrepresented in data studies. Whether this is bias, lack of data or more focused on technical areas, the fact remains that goalkeepers are not evaluated as much via data. When goalkeepers are evaluated on data it is often linked to attackers in the form of shot-stopping: how good is a goalkeeper at preventing goals? What are the difficulties of the shot being faced? All these questions are being raised in relation to scoring metrics.
Goalkeeping is much more than just shot-stopping. We can look at distribution, leaving the line, reflexes, ball handling, and sweeping. Before, we just looked at 1 or 2 categories, but lately we can identify and separate more categories, which makes data analysis of goalkeepers more valuable.
With those distinctions, we can create new metrics, scores, index and models. This could open a whole new spectrum in data analysis, and this article is just a small part of what we can do with goalkeeper data.
Data collection
The data used in this research is event data coming from Opta/StatsPerform. It contains the raw data of the 2024-2025 season of the Italian Serie A of the UEFA confederation. It was collected on August 18th, 2025.
For those who have worked with this kind of data, we need to prepare a few things so that it works before we start the analysis. It is important to look in the qualifiers to find the endX and endY coordinates, so you can create those columns. Believe me, that will make it easier to plot passes. The qualifiers and events are crucial when you are working with Opta data, and you can find some mapping here:
Events: Opta - Events
Qualifiers: Opta - Qualifiers
The last thing, which also is very important, is to use the right filters. We have to deal with goalkeepers, so I only want goalkeepers in my database. Those goalkeepers should also have played a minimum if 900 minutes (equivalent of 10 full games without additional time) for me to properly data analyse them.
When we have done that, we are ready to start the real work.
Modelling distinct playing styles in Women's football

There is a thing about women’s football what I don’t like and that’s the lack of publicly available data. And if there is data available, it’s often flawed and very small in variety. One of my aims for this year and the years to come is to help in changing that. Sharing my experiences and metrics, but also opening up possibilities to work with data.
Aim
So what’s the aim with this article or my research for that matter? My aim is to show what we can do with on-ball event data for goalkeepers. Added to that, I want to show we can use data in goalkeeper to distinguish different categories and evaluate goalkeepers. Ultimately, a model is created that does exactly that and will give different audiences a quick overview of how a goalkeeper has performed in a match or a season.
Theory: What do I want to create?
I want to create something tangible and actionable. But before I can do that, I have to set out my own theoretical framework of how I’m going to achieve that exactly. My aim is to first create 5 scores:
Shot-stopping
Leaving line
Distribution
Ball handling
Set piece
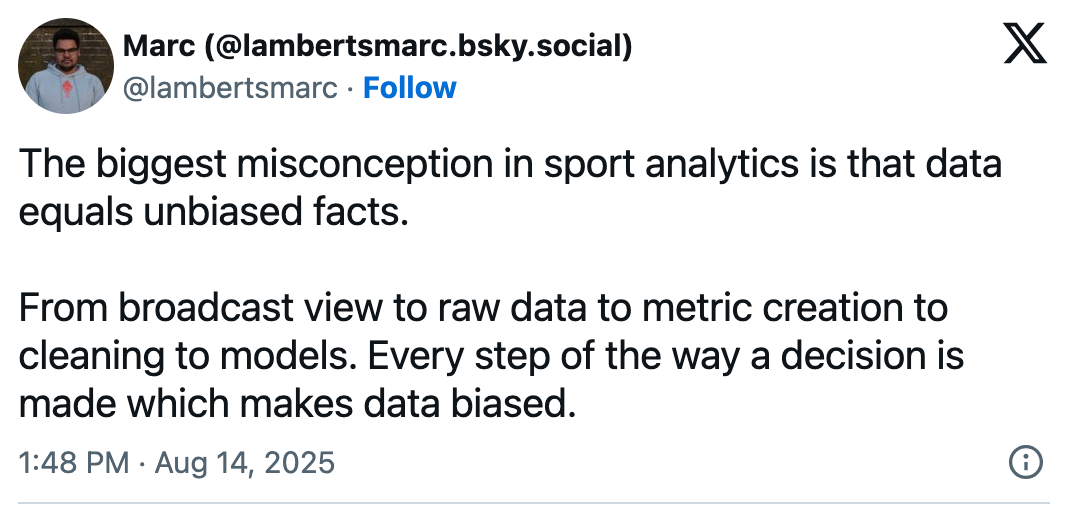
All of these scores consist of metrics that exist or that I have to create. My aim is to create the metrics myself as much as possible, because then the model is more in control of what I’m doing and in my decisions in data. Another reminder that data is never unbiased, because a human will create the metrics by making certain choices.
These scores form the essence of my model, because they are features for creating my model. Every action will have a value and be flagged for a specific category. By doing so I can have a total score for each category and one final score for the performance of that match or season.
Methodology
The files I need for this analysis come in either CSV or JSON files. I use Python as my programming language for the calculations and visualisation, but others are good as well: R and Julia are often used for this too.
This model evaluates goalkeeper performance using a Threat-Based Value methodology, which quantifies a goalkeeper's impact on a match by measuring how their actions either reduce or increase the opponent's probability of scoring. The core of the model is a custom expected value grid, which assigns a threat value to every location on the pitch. This value represents the likelihood of a goal being scored from that position. By analysing a goalkeeper's actions, like a pass, a save, or a clearance, the model calculates the change in EPV between the start and end of the event, assigning a positive value for actions that decrease opponent threat and a negative value for those that increase it. The model is built on four key phases of a modern goalkeeper's role:
1. Shot Stopping: This is the most traditional aspect of goalkeeping. The model's value is calculated as the change in threat from the moment a shot is taken to the outcome of the shot. A save that eliminates the threat receives a higher positive value than one that results in a rebound, which still carries a residual threat. A conceded goal, by contrast, yields a significant negative value. This approach accounts for the quality of the save and the subsequent state of play, rewarding goalkeepers who make clean, secure saves over those who push the ball back into a dangerous area.
2. Distribution: A goalkeeper's ability to start an attack is a crucial part of modern football. The value is determined by the xT change from the start point of a pass to its end point. The model rewards a successful, forward-moving pass that progresses the ball into a more threatening area for the goalkeeper's team. Conversely, an incomplete pass is penalised, as it turns over possession and puts the team at risk. The model also distinguishes between short passes for build-up, medium passes, and long passes (launches), providing a breakdown of the goalkeeper's distribution profile.
3. Leaving the Line: This phase measures a goalkeeper's proactive role outside the penalty area, such as sweeping behind the defensive line or claiming crosses. The value here is based on the threat reduction achieved by the goalkeeper's intervention. For example, a proactive clearance that prevents a dangerous through ball from reaching an attacker is highly rewarded, reflecting the threat that was neutralised. Similarly, claiming a cross in a crowded box is seen as a high-value action because it eliminates a scoring opportunity that could have materialised from the cross.
4. Ball Handling: This category covers a goalkeeper's actions when they have the ball in their hands, including securing catches, deflecting shots, and handling spills. It is valued based on whether the goalkeeper securely controls the ball (neutralising threat) or creates a rebound or error, which increases the opponent's threat. A secure catch is a high-value action, whereas a spill that leads to a subsequent shot or goal is heavily penalised. This metric highlights a goalkeeper's reliability and decision-making under pressure.
Interquartile Ranges and Boxplots in Football Analysis

By writing regularly, I have concluded that I like discussing data from a sporting perspective: explaining data methodology through the lens of sport, football in particular. I have always set out to work in professional football, and I am very lucky to have reached that, but I want to keep creating, and that is why my content has become increasingly ab…
Final product
The final outputs of the GK Threat-Based Value Model transcend raw data, providing a comprehensive and intuitive overview of a goalkeeper's performance. All individual event values (Vevent) are aggregated and normalised by the total number of events in each phase. These normalised scores, Vˉphase, are then combined into a single composite value using a weighted sum:
S=B+ωssVˉss+ωdistVˉdist+ωllVˉll+ωbhVˉbh
Here, B is a baseline score, and the ω parameters are predefined weights for each phase. This linear combination yields a single Match Score on a 0-100 scale, providing a complete picture of the goalkeeper's overall contribution.
The model also generates a series of key visualisations:
Half-Pitch Heatmap: This graphic provides a macro view of the goalkeeper’s value creation across their half of the pitch. Areas of high-value actions are represented by warmer colours, offering a high-level spatial analysis.
Half-Pitch Points Map: For a more granular view, this map plots every individual event. Each point is color-coded by its value and shaped according to its performance phase, allowing for detailed, event-by-event analysis.
Worst 10 Distribution Plot: This visualisation specifically highlights the ten most negative distribution events, providing targeted feedback on areas needing improvement.
Finally, a detailed Scorecard and a quantitative Excel report combine these outputs with traditional statistics (goals prevented, pass completion rate, etc.) to offer a multifaceted and data-rich assessment. The final product is a powerful tool for analysts and coaches to derive actionable insights, moving beyond surface-level observations to a true understanding of goalkeeper performance.
Analysis
So we have done all calculations and there are two visuals which tell me a lot about goalkeepers that I will want to show you here.
The first visual is the worst distribution plot. In terms of value generated, which passes are the lowest?
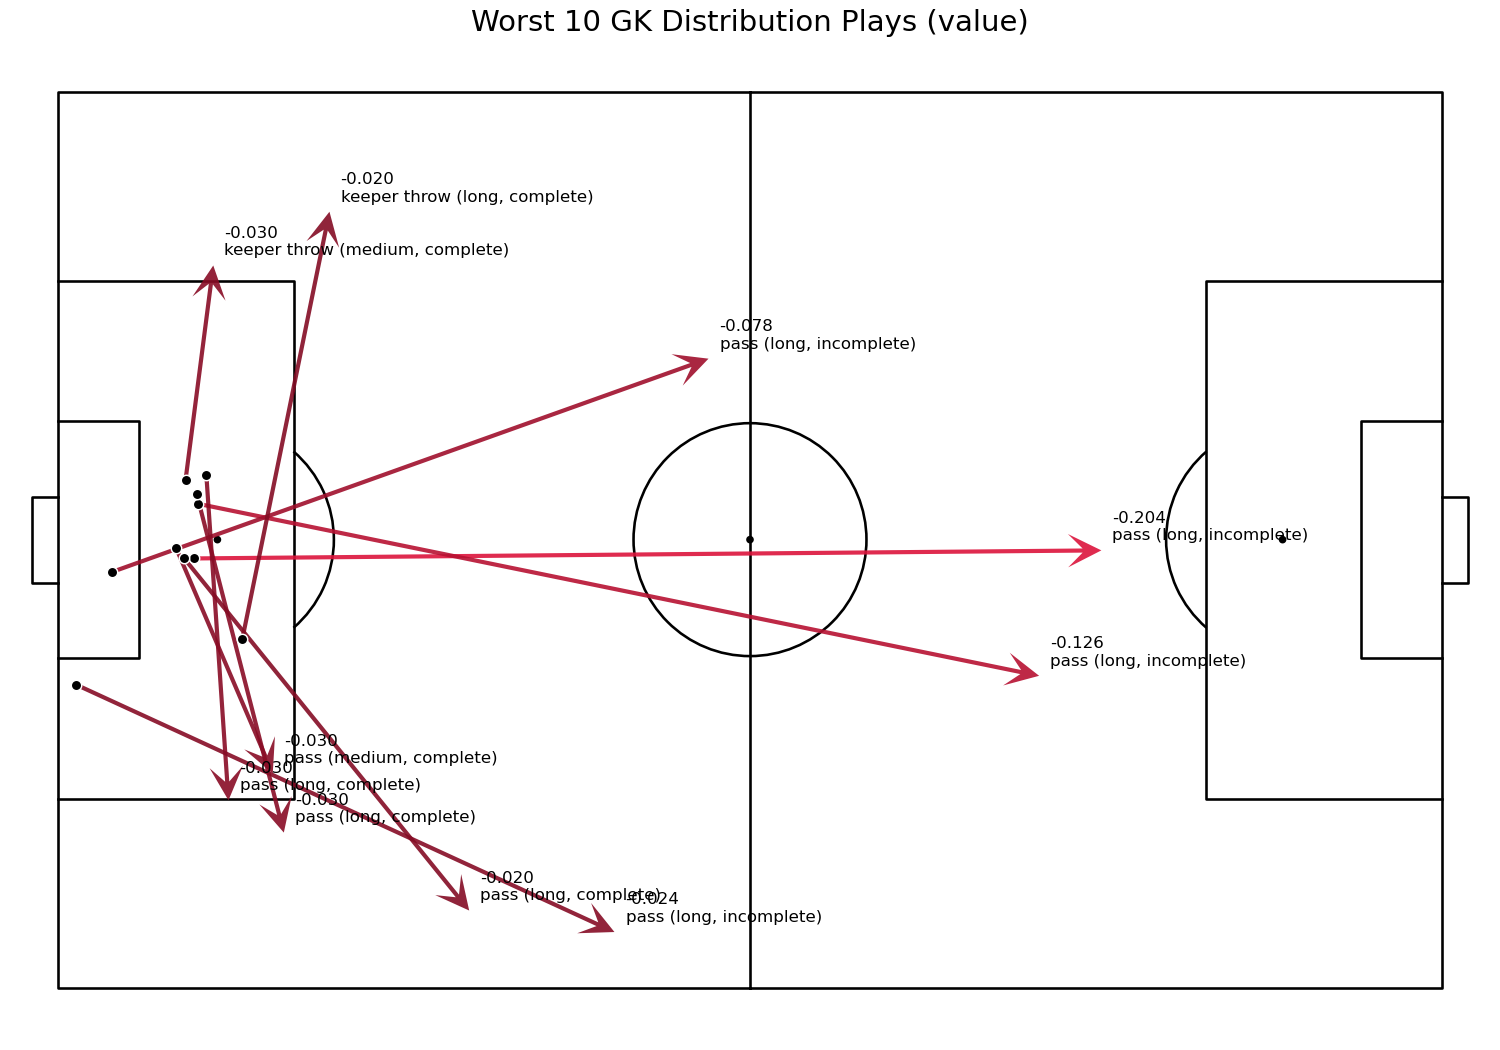
This pitch shows us the distribution by the goalkeeper Maignan in the game against Roma. These are the 10 worst goalkeeper distributions and every pass has the value next to it. It shows patterns of the goalkeeper in terms of distribution and how much effect in value these have. It this becomes a structural thing, the gk coaches can work on that together the goalkeeper to enhance this part of his play.
Obviously, this is just one part of goalkeeping and we can see a more complete example of goalkeeper performance in the score card I have created based on the aforementioned models.
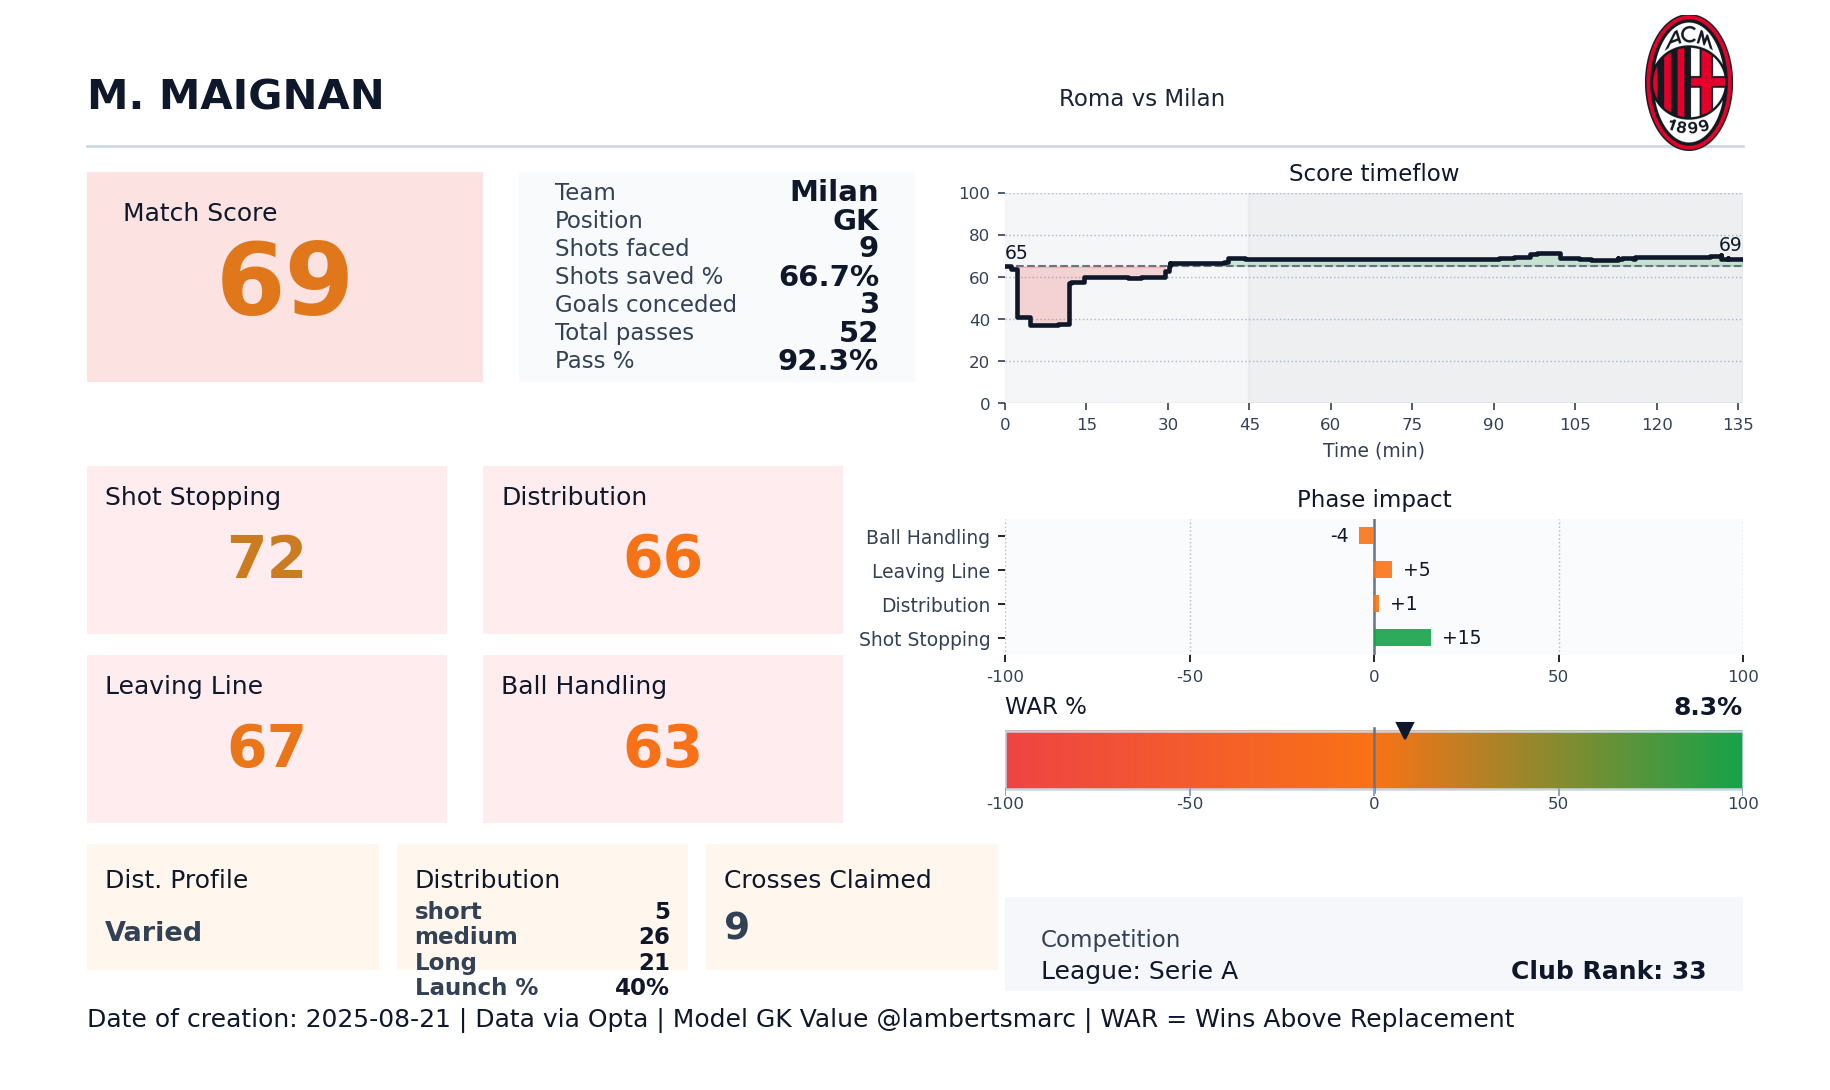
In this score card you a plethora of information. First, in the tiles we see the total match score (69). This is the weighted total of shot stopping score (72), distribution (66), leaving line (67) and ball handling (63).
The next three tiles show distribution statistics and leaving line. The distribution profile is based on the distribution length. Varied, mixed, launch-heavy and short build-up. Next tile shows how many of the passes were short, medium and long - and a launch % added. The third tile shows how many crosses were claimed in this game.
The text box in the middle shows some regular statistics of the game which arent’t very groundbreaking.
The three visuals on the right are one of the most interesting things about the whole research:
Score timeflow: this shows the total score of the goalkeeper throughout the game. Every goalkeeper starts with a score of 65 and the negative/positive values of the actions make the change. This shows what score the goalkeeper is on any given time in the game. He started badly and recovered against the end of the game.
Phase Impact: this shows the total impact in score of each specific phase on the game and score. In this case the goalkeeper scores high on shot-stopping, low on ball handling, and slighlty positive on leaving line and distribution.
WAR%: Wins above replacement percentage. Based on this game the goalkeeper would contribute 8,3% to a win.
League is Serie A and the rank is 33, which is the current Opta Power Ranking.
Final thoughts
It took quite some time to compile this all and it’s a good start to comparing goalkeeper’s performances across games. It gives me critical information about a goalkeeper after the game and can point me in the direction of where I have to improve the goalkeeper’s performance and/or in lesser extent how the defensive units operate in front of the goalkeeper.
I am very well aware this is the beginning of a model. I think the concepts of making performance models or predictive models is easier to create then to improve. So while I think has potential, I really need to have a look again and improve on the things I’m not happy about.
When I’ve done that, I will create a package for Python so it will be easier to use for everyone that has access to event data and can create these kind of visuals for themselves.