
Stretched Play Value Model: evaluating which player stretch
Using passing received maps, switches and touches to make an educated guess without tracking data on which players stretch play

One of the most difficult things in working with data is having the right data. There are different types of data, but sometimes we are not sure what we can do with all the data. Why am I saying this? This is because I have been adament to have tracking data for all the leagues. And, that’s simply not possible.
What I do have for almost all the leagues I’m interested in, is the raw event data. In the absence of tracking data, I could still create meaningful models that infer off-ball actions. Big point to make: this isn’t as correct or representative as tracking data, but we can make a suggestive data model about off ball actions.
In this article, I’m going to exercise that concept and look at off-ball actions of wide players. How can we see whether players stretch play with a value model?
Contents
Data: data collection and representation
Why this model?
The risks of using event data to suggest tracking data
Theoretical framework: mathematics and statistics
Methodology
Results
Analysis: NWSL
Final thoughts
1. Data collection and representation
First of all, it is important to know what kind of data we use and which things we need to change in order to make sure the model is accurate as can be. The data I’m using is event data from the NWSL 2025 season. This season is ongoing, but I have updated the data until the 12th of September, 2025. The data comes from Opta/Statsperform.
The event data is raw data and it shows the positional data of all on ball data of the players and teams incorporated in the JSON files. I prefer JSON files for processing, but you can convert them to CSV/Excel files as well. My experience is that it will take longer to process if you convert ehm.
I don’t do a lot with the data once I have collected, but since their are no endlocation in the original dataframe, I need to create that explicitly from the qualifiers. Qualifiers 140 and 141 represent the endX and endY, which will be used for the endlocations of the passes, which will play an integral part of this research and calculations.
2. Why this model?
Why the hell would you do this, Marc? Why would you want to create a suggestive off-ball model while you also can do this with tracking data? Now that’s an excellent question, rhetorical Marc. There are two reasons why I do this:
Not everyone has access to tracking data, but has some access to event data. There are workarounds which might be less accurate, but still give a pretty decent overall picture.
The challenge. I would like to challenge myself to become better in using mathematical concepts and calculations, and this process will definitely play a part.
Finding players with the Innovative Pass Index

If you are reading this, you are probably very interested in what you can do with data in football. One of my flaws is that I constantly am looking for new models. I want to innovate and create, basically finding the next expected goals to be important in the analysis space. Okay, that’s perhaps more into my brain than needed, but it’s an important lesson for me: I don’t always have to create everything from raw data.
3. Risks of using event data to infer off-ball actions
Using event data to calculate off-ball stretch of play carries significant risks because it only captures moments when the ball is directly involved, leaving large gaps in the spatial and positional context of players who are not participating in the on-ball action. This can create misleading interpretations of team compactness or width, since stretches of coordinated off-ball movement, such as defenders shifting as a unit or attackers rotating to drag markers, often occur outside the scope of event-based logs.
Another risk lies in the timing and granularity of event data, which is typically sparse compared to tracking systems that capture positions multiple times per second. Because event data is recorded only when specific actions happen (passes, shots, tackles), it overlooks continuous off-ball dynamics, making any reconstruction of player movement heavily assumption-based. This can result in artificial compression or expansion of play stretches depending on how the gaps are interpolated.
4. Theoretical framework: mathematics
The arithmetic mean, often just called the "average," is a single value that represents the central tendency of a set of numbers. It's calculated by summing all the values in the collection and then dividing by the count of those values. Think of it as a way to find a "fair share" value. For instance, if three friends have 2, 4, and 6 cookies respectively, the total is 12 cookies. The arithmetic mean would be 12÷3=4, meaning if the cookies were redistributed equally, each friend would get four. This concept is fundamental in statistics for summarizing data, allowing us to quickly grasp a typical value within a dataset, like the average temperature in a week or the average score on a test.
The Cartesian coordinate system is a graphical framework used to pinpoint the exact location of any point on a flat plane. It's built around two perpendicular number lines: a horizontal x-axis and a vertical y-axis.

Their intersection point is called the origin (0,0). Any point on the plane is uniquely identified by an "ordered pair" of numbers (x,y), which represent its signed distances from the origin along each axis. This system acts like a grid map, allowing us to translate geometric shapes into algebraic equations and vice versa. It's the foundational language of geometry, physics, and computer graphics, enabling precise location and movement tracking.
Euclidean distance is the most intuitive way of measuring the length of the straight line connecting two points. It’s the "as the crow flies" distance, ignoring any obstacles or required paths. In a two-dimensional plane, it's calculated using the Pythagorean theorem by creating a right-angled triangle with the line segment as the hypotenuse. If you have two points, (x1,y1) and (x2,y2), the distance is found by taking the square root of the sum of the squared differences of their coordinates: (x2−x1)2+(y2−y1)2. This measurement is crucial in various fields, from GPS navigation calculating the shortest route to algorithms that group similar data points.
Methodology
The methodology begins by loading and structuring the raw match event data from a JSON file. Each event, such as a pass or a touch, is flattened into a single row in a table. The script then applies a crucial filter, isolating only the passes that are specifically tagged as a "Switch of play." This narrows the focus to long, field-switching passes intended to stretch the opposition's defense. For this analysis, it first identifies all the successful switches of play. This initial step is essential as it creates a refined dataset focused exclusively on the specific type of strategic pass being investigated, clearing away all other irrelevant actions from the match.
Once successful switches of play are identified, the script determines the receiver of each pass. It does this by looking at the event immediately following the pass in the timeline and assigning the reception to the player who performed that next action. After collecting all of a player's receptions, it calculates their personal average receiving position on the pitch by taking the mean of all the (x,y) coordinates where they successfully received these passes. This average point becomes the center of a theoretical circular "receiving zone" for that player. This method effectively creates a data-driven profile for each player, mapping out the specific area on the field where they are most typically targeted for long, stretching passes.
In the final step, the script evaluates every "switch of play" attempt from the match, including both successful and unsuccessful ones. It checks if the end coordinates of each pass fall within any player's predefined receiving zone using Euclidean distance. By counting both the successful receptions and the unsuccessful passes aimed at a player's zone, it calculates the TotalPassAttemptsReceived. This total is then multiplied by the average length of those passes to create a Stretch Value Model score, which quantifies a player's role as a deep target. This score is then normalized to a 0-100 scale, providing a clear, ranked list of players based on their value in stretching the field.
Analysis
Now we have calculated the metrics we want to use:
PassesReceived
UnsuccessfulPassesToArea
TotalPassAttemptsReceived
TotalTouches
AverageTargetedPassLength
Stretch Value Model
Normalized Stretch Value (0-100)
AverageReceivedX
AverageReceivedY
With all this information we can start having a look at the players who have been target the most with passes from switches. This means from one side of the pitch to the other side of the pitch. These are all passes attempted to that player or the area of the player, including unsuccessful attempts:
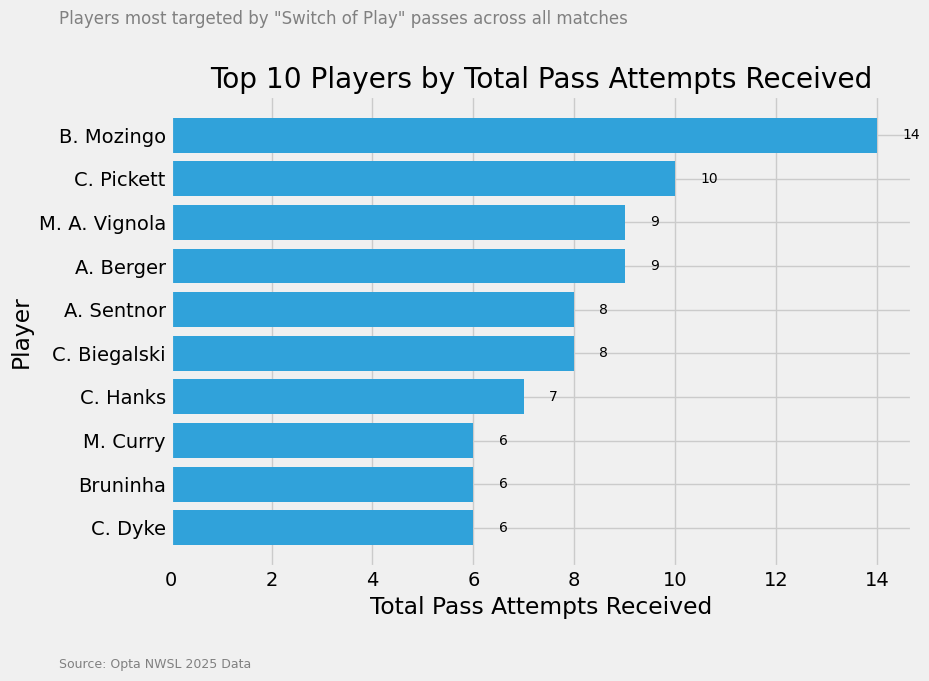
In the bargraph above you can see which players have received the most switch passes to the wide areas during the 2025 season. As you can see those are not many passes, but that’s also because we are quite strict with our filtering. Mozingo, Picket and Vignola are most targeted.
Now which players have the highest percentage of actually receiving that specific targeted pass?
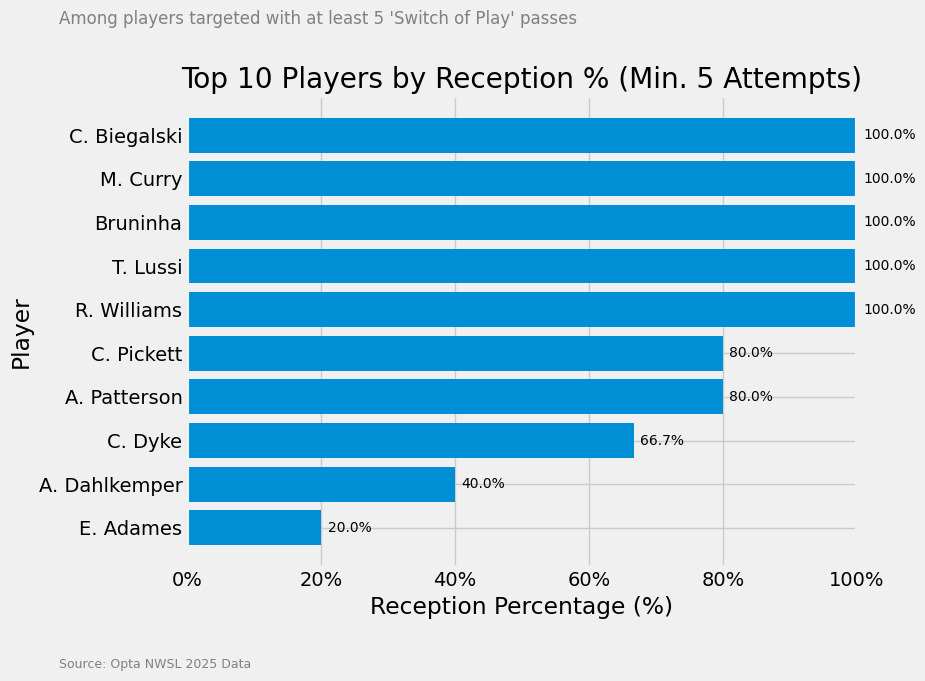
As you can see Biegalski, Curry, Bruninha, Lussi and Williams all have 100%. Which is actually great for the passes, but not something we are looking for.
Streched play can be calculated has high attempted passes and not many touches in that area, which we also include lower % of reception. This bar graph above doesn’t tell us a whole lot about this. We don’t get closer to our goal. So let’s have a look at the total of touches in that area in comparison to the attempted passes.
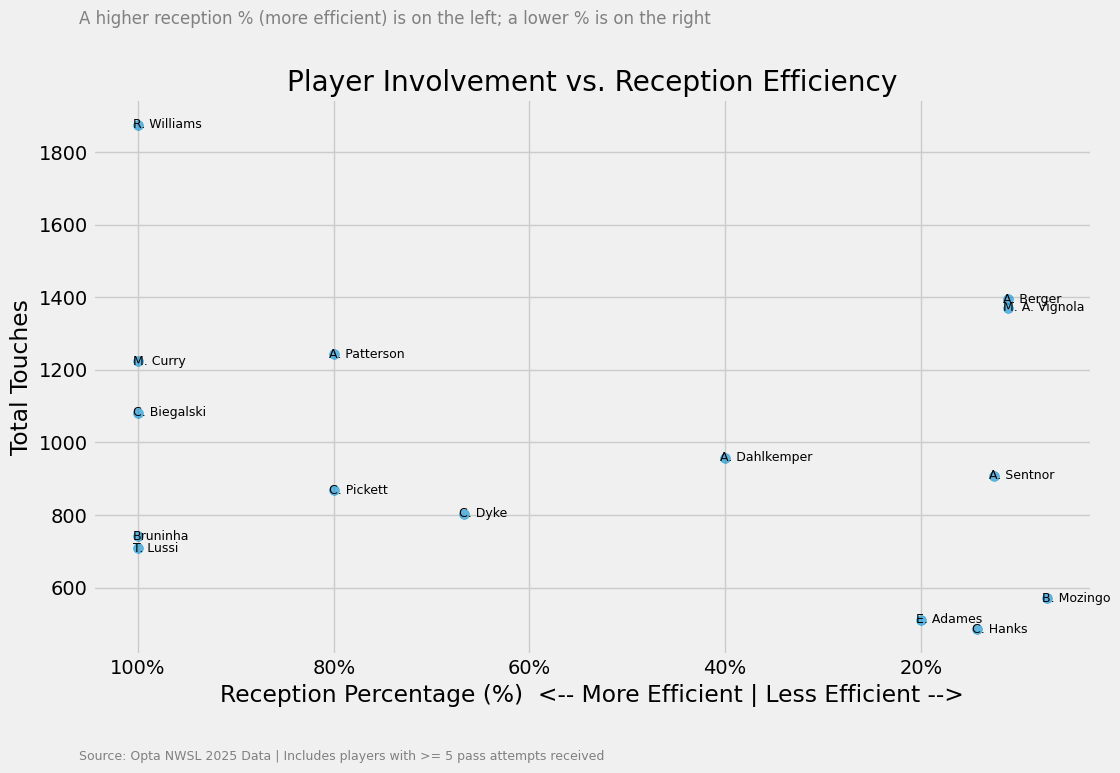
This gives a much better idea of which player are likely to stretch play much more. Low efficiency on receiving passes and lower touches in those area. The players who are interested to follow are Adames, Hanks, Mozingo and also Sentnor.
Now we have to go to the value model, because we will use the Player Stretch Model to do that well.
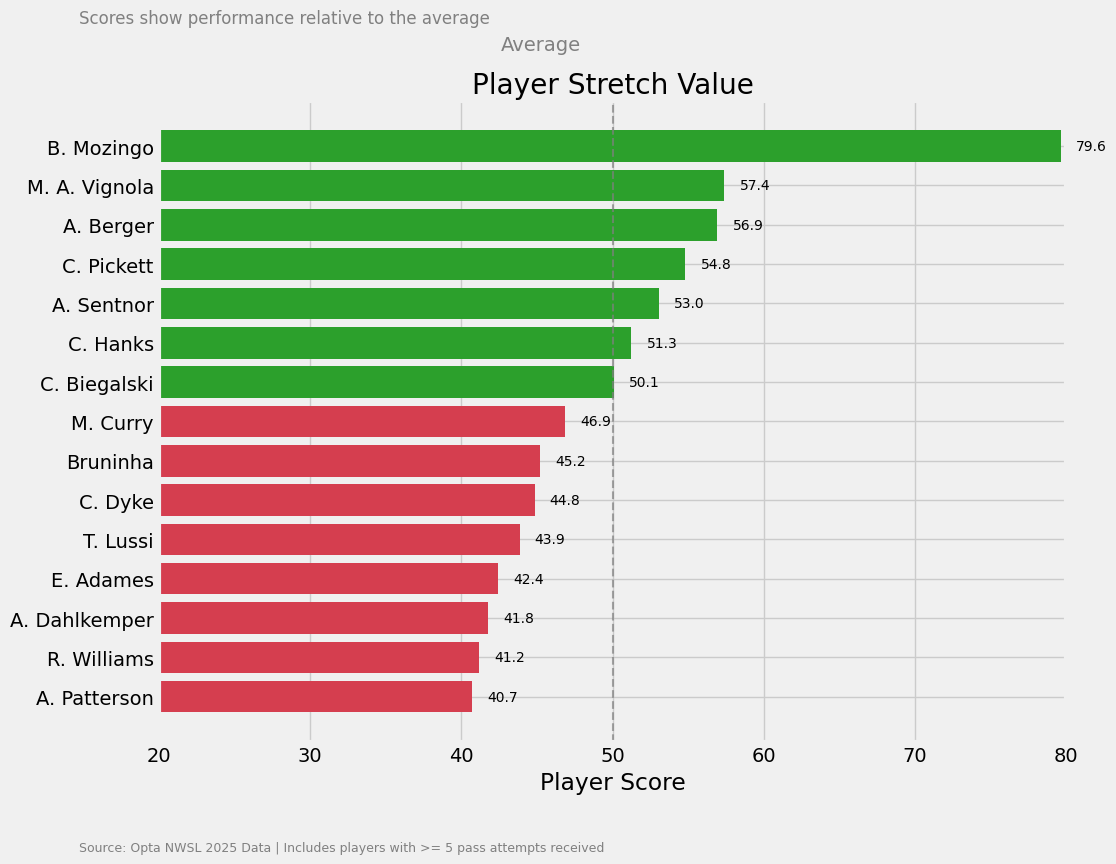
What we can see in this bargraph above, Mozingo clearly has the highest value of suggested stretched play, but Vignola, Berger and Pickett are very close to each other. These players are players that are often attempted to reach, not often get the ball or have many relative touches in that area. We can therefore imply/suggest that these are players that stretch the play.
Let’s focus on the player who scores highest on the Stretch Value Model. Where does she average her receptions and touches?
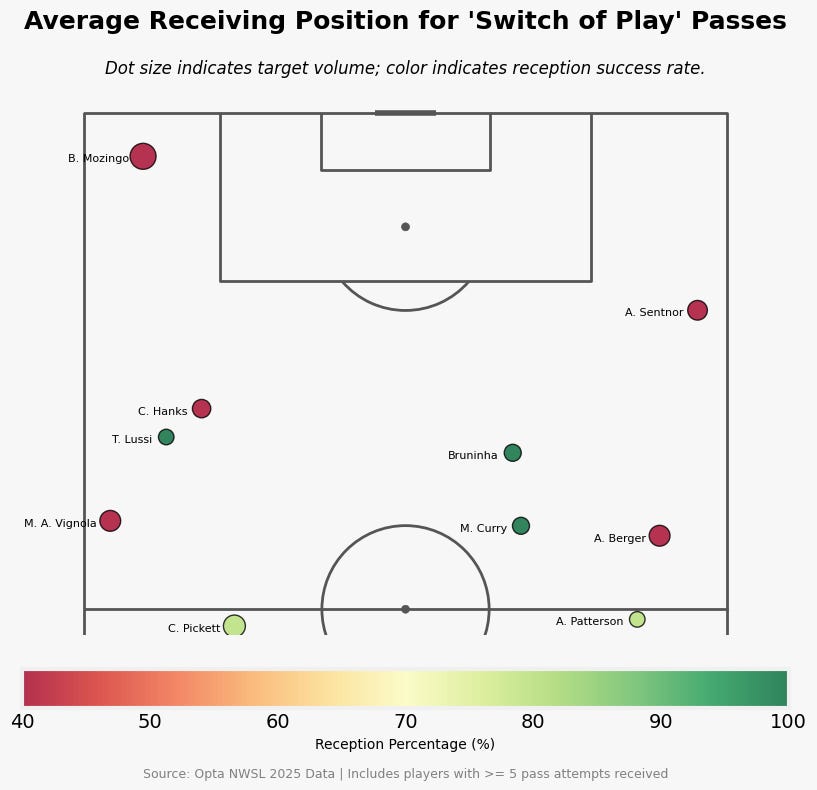
As you can see she scores highest because of her reception rate and low touches, but there are also other factors. One of the most important is that she really hugs the side line, that also helps with stretching the play as wide as possible.
Final thoughts
I think this has been a good exercise in using event data to answer a question. Is it as effective and correct as tracking data? Oh no, I don’t think so. It does however, give suggestions to players you could watch on video and see if they stretch the play as suggested. But the main part is about the thought process, how can we be creative and use data to get to innovative insights.