
The Sky is the limit: introducing the Aerial Spatial Impact Rating (ASIR)
A data-driven look at why traditional aerial dominance is an analytical dead end


Asserting dominance is what many managers talk about. They talk about controlling midfield, central areas, and “wanting” it more. According to their knowledge and view, this would also lead to winning games thanks to that asserted dominance. It seems a bit of a wild idea, and I’m not sure there is a correlation. However, this is a worthy exercise to conduct in terms of data, so that’s why I’m taking you on this research data.
The aim for this research is to see whether traditional metrics can capture the correlation, if there is a difference with innovative metrics, and whether it’s actually useful research to use going forward. The data is raw event data from Opta and was collected on October 7th 2025. To get a sense of a more global impact, I’ve selected multiple leagues and not just one specific league.
The Traditional Metric: Volume vs. Percentage
First I will start with the traditional point of view. This is the standard quantity vs quality point of view in terms of aerial duels. We want to see the total volume of aerial duels in a game or season (quantity) and compare that too the win % (quality). This gives us an idea of which players, teams or league perform the best in winning aerial duels.
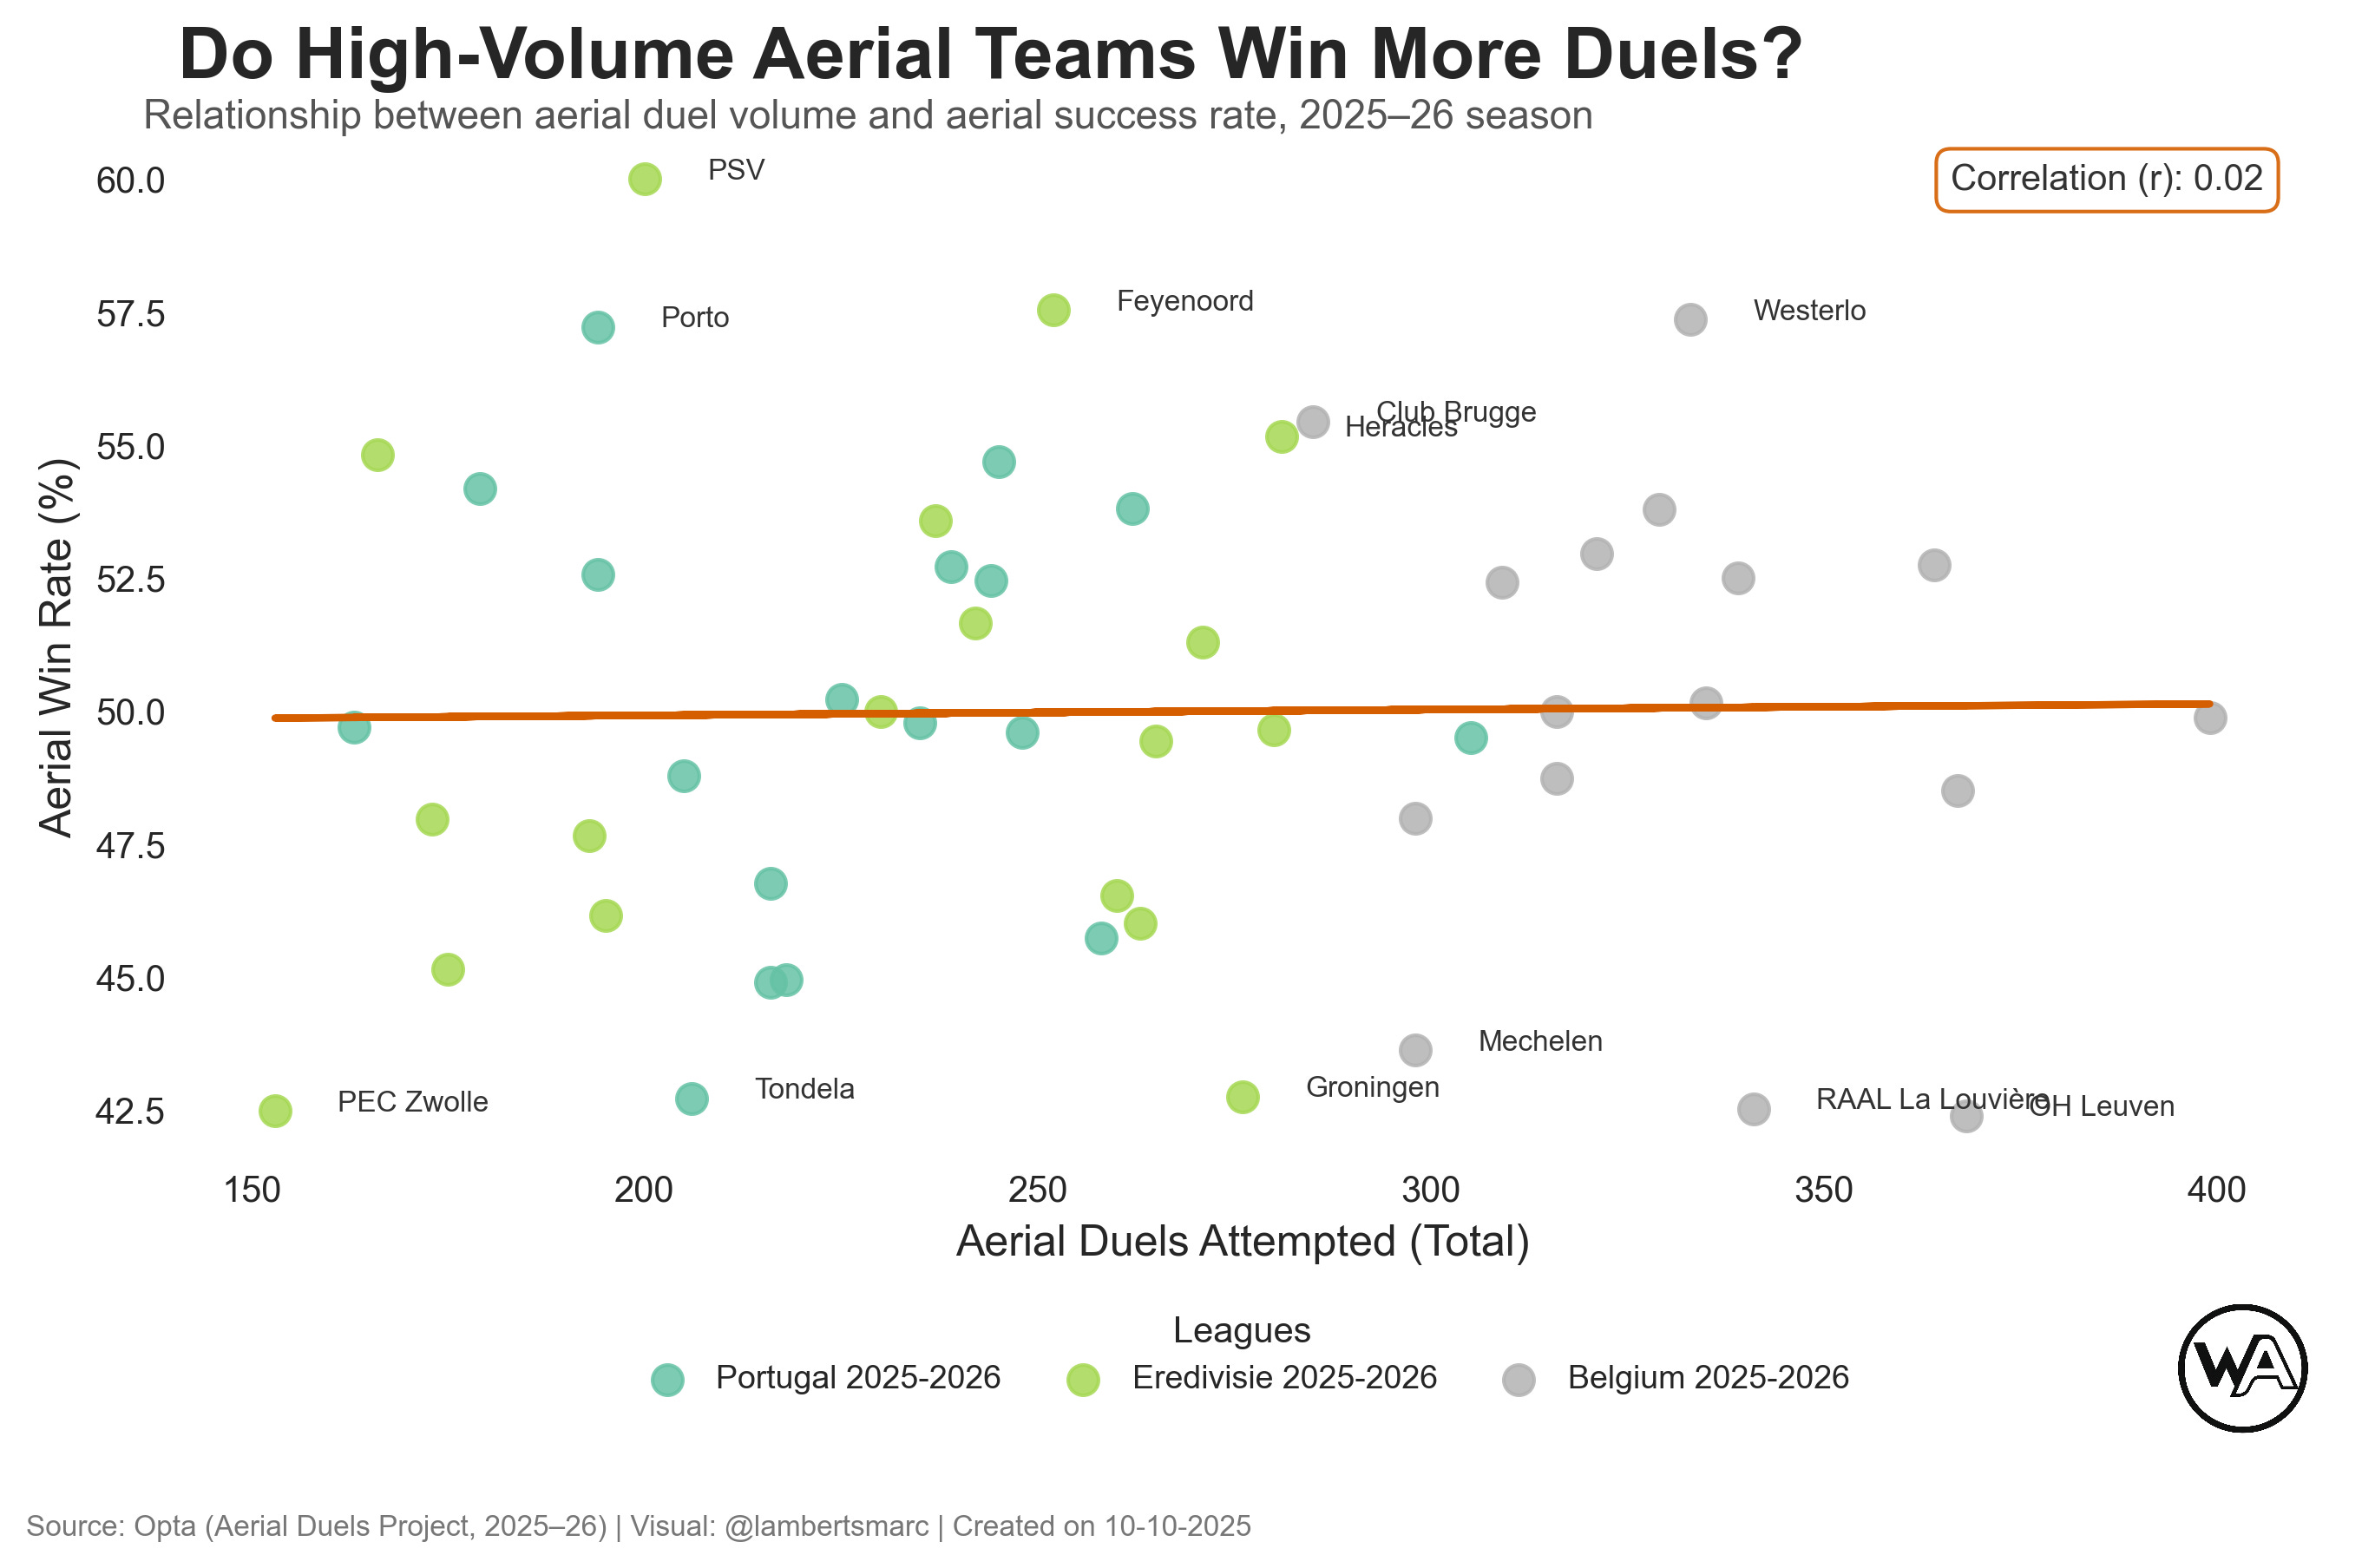
If we look at the above scatterplot, we see the volume of aerial duels on the x-axis and the aerial win rate in % on the y-axis. The top 10% outliers are featured as you can see across the three leagues we are looking at. The correlation between the aerial duels count and the aeriel duels win rate is calculated via the Pearson Correlation Coefficient. The correlation is 0,02 which indicates that there is is a very weak linear correlation → a change in one metric doesn’t predict linear change in the other metric.
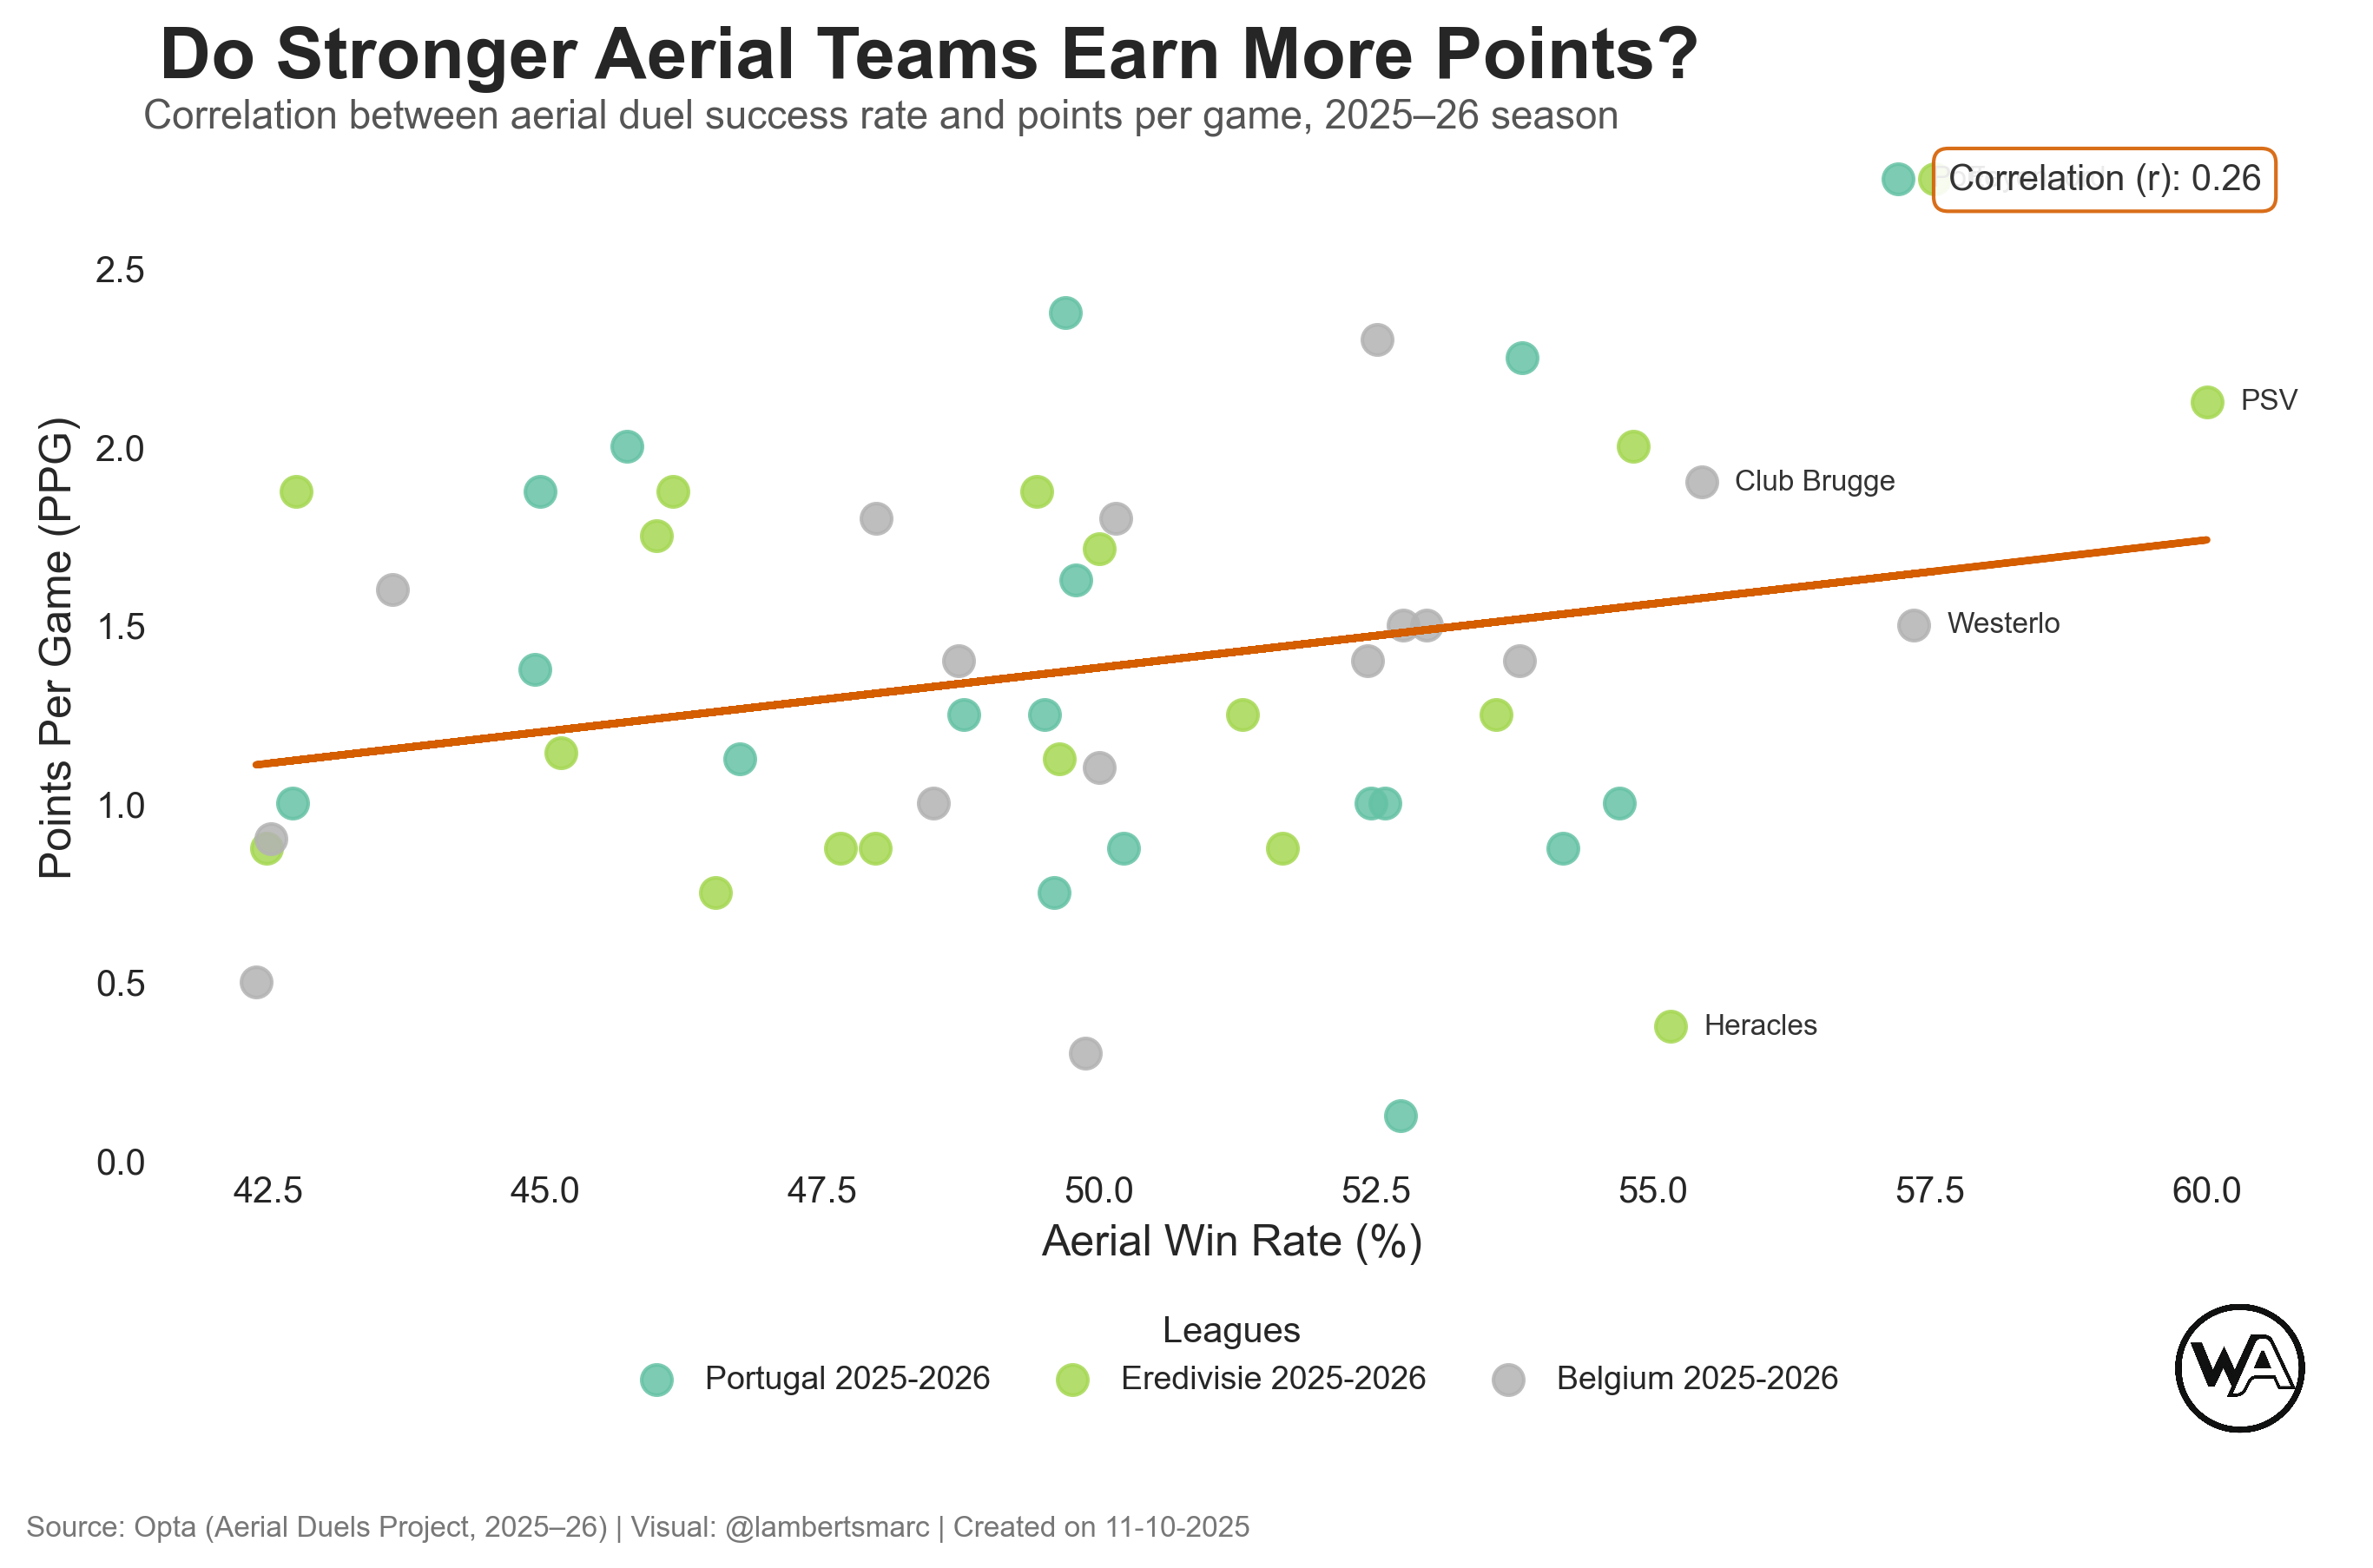
In the scatterplot above you can see a different set of metrics. On the x-axis you can see the aerial win rate in % and on the y-axis the Points per Game (PPG). We are looking here at the correlation between winning aerial duels and PPG → does winning more aerial duels lead to more points?
The correlation is 0,26, which is more than 10 times higher than the previous plot, but what does this exactly mean? Teams that win more aerial duels tend to get slightly more points, but many exceptions exist, and aerial strength alone doesn’t explain much of the performance.
Our idea of winning more duels leads to more points, which doesn’t seem like a strong prediction. There’s some correlation, but not so strong that we can say this effectively works.
The New Model: Aerial Spatial Impact Rating
So we have seen that the traditional metrics don’t really hold up in terms of correlation, what could? In other words, can we design meaningful data metrics that can say a bit more about winning aerial duels in relation to winning games. I designed a new rating called: Aerial Spatial Impact Rating.
The Aerial Spatial Impact Rating (ASIR) quantifies a team’s performance in aerial duels by integrating event outcomes with spatial weighting to reflect the tactical relevance of duel locations. The methodology involves four main stages: data collection, spatial zoning, weighting, and aggregation.
1. Data Collection and Preprocessing
Event data were extracted from structured JSON files containing Opta match data for the three different leagues. Each file represents a single match and includes detailed attributes for every on-ball action. Aerial duels were identified using the event type identifier typeId = 44. Each event was linked to a team via its contestantId, with team names mapped using a separate CSV file containing official identifiers. Events without valid positional data (x, y) or team assignment were excluded.
2. Spatial Zoning Framework
The pitch was divided into a 3×3 grid combining longitudinal thirds (defensive, middle, attacking) with lateral zones (wide, central). Each event’s coordinates were assigned to one of these nine spatial zones. This framework allows for weighting aerial duels based on their strategic context rather than treating all duels uniformly.
3. Spatial Weight Assignment
A weighting function was defined to assign a numerical value to each zone reflecting its tactical significance. Central attacking zones were assigned the highest weight (1.5), followed by half-spaces in the attacking third (1.3), and central defensive zones (1.2). Wide areas received a lower weighting (0.75), as aerial duels in these areas generally exert less influence on match outcomes. This weighting matrix was implemented via a zone weight (x,y) function, which returned the appropriate multiplier based on the event’s location.
4. ASIR Computation
For each team in each match, the ASIR value was calculated by dividing the total weighted number of successful aerial duels by the total weighted number of all aerial duels. In this calculation, every duel is assigned a spatial weight according to its location on the pitch, reflecting its tactical importance. Successful duels contribute their respective weights to the numerator, while all duels—successful or not—contribute their weights to the denominator. The resulting ratio expresses the proportion of aerial duels won, adjusted for spatial significance, and produces a match-level ASIR score ranging from 0 to 1.
In the bargraph above, you can see the top 12 teams according to the ASIR. PSV, Porto and Feyenoord form the top 3. It’s a score that takes aerial duels into account with their specific areas. The Eredivisie is featured the highest, then followed by Belgium and then Portugal.
The Positional and Zonal Breakdown
We know which teams score the highest on our new ASIR-rating, but let’s have a look at how and where they are generated.
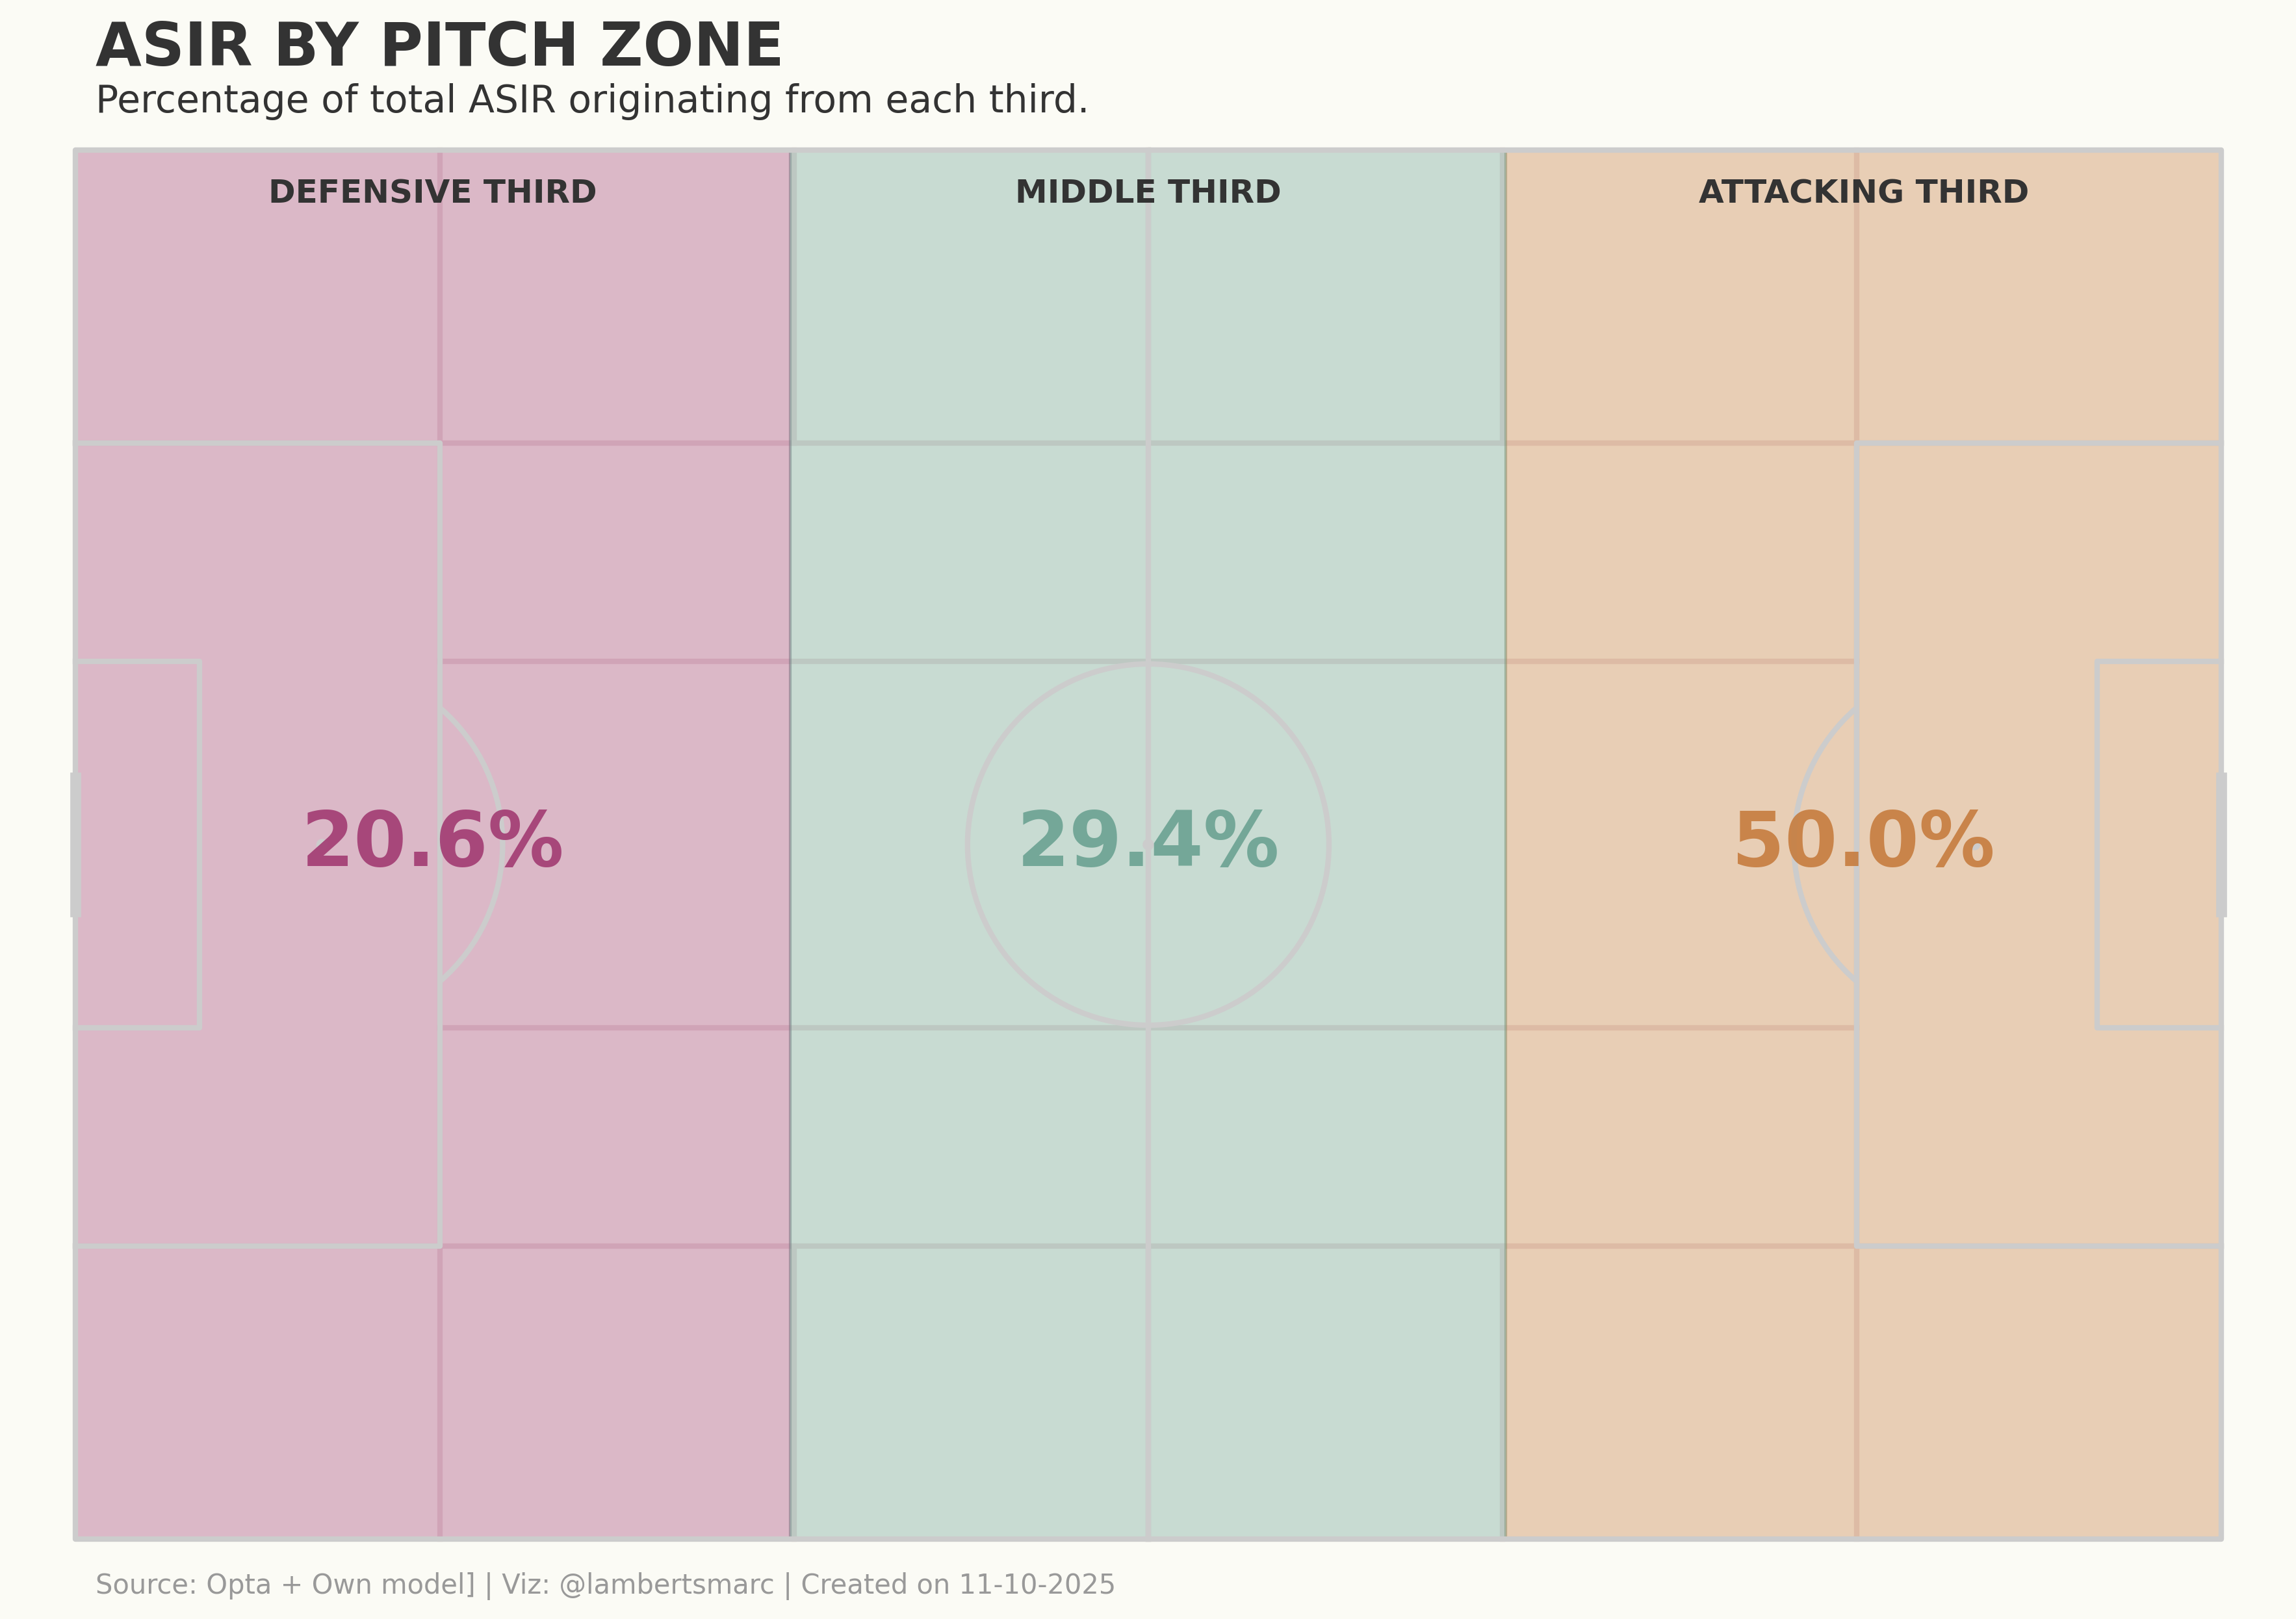
In the pitch above, you can see the different third of the pitch with the perecntages of the total ASIR. Aerial duels won in the defensive third are easier to predict than they are in the attacking third, and that’s why the attacking third has a higher percentage of our new score. Attacking third has 50%, middle third has 29,4% and defensive third has 20,6%/
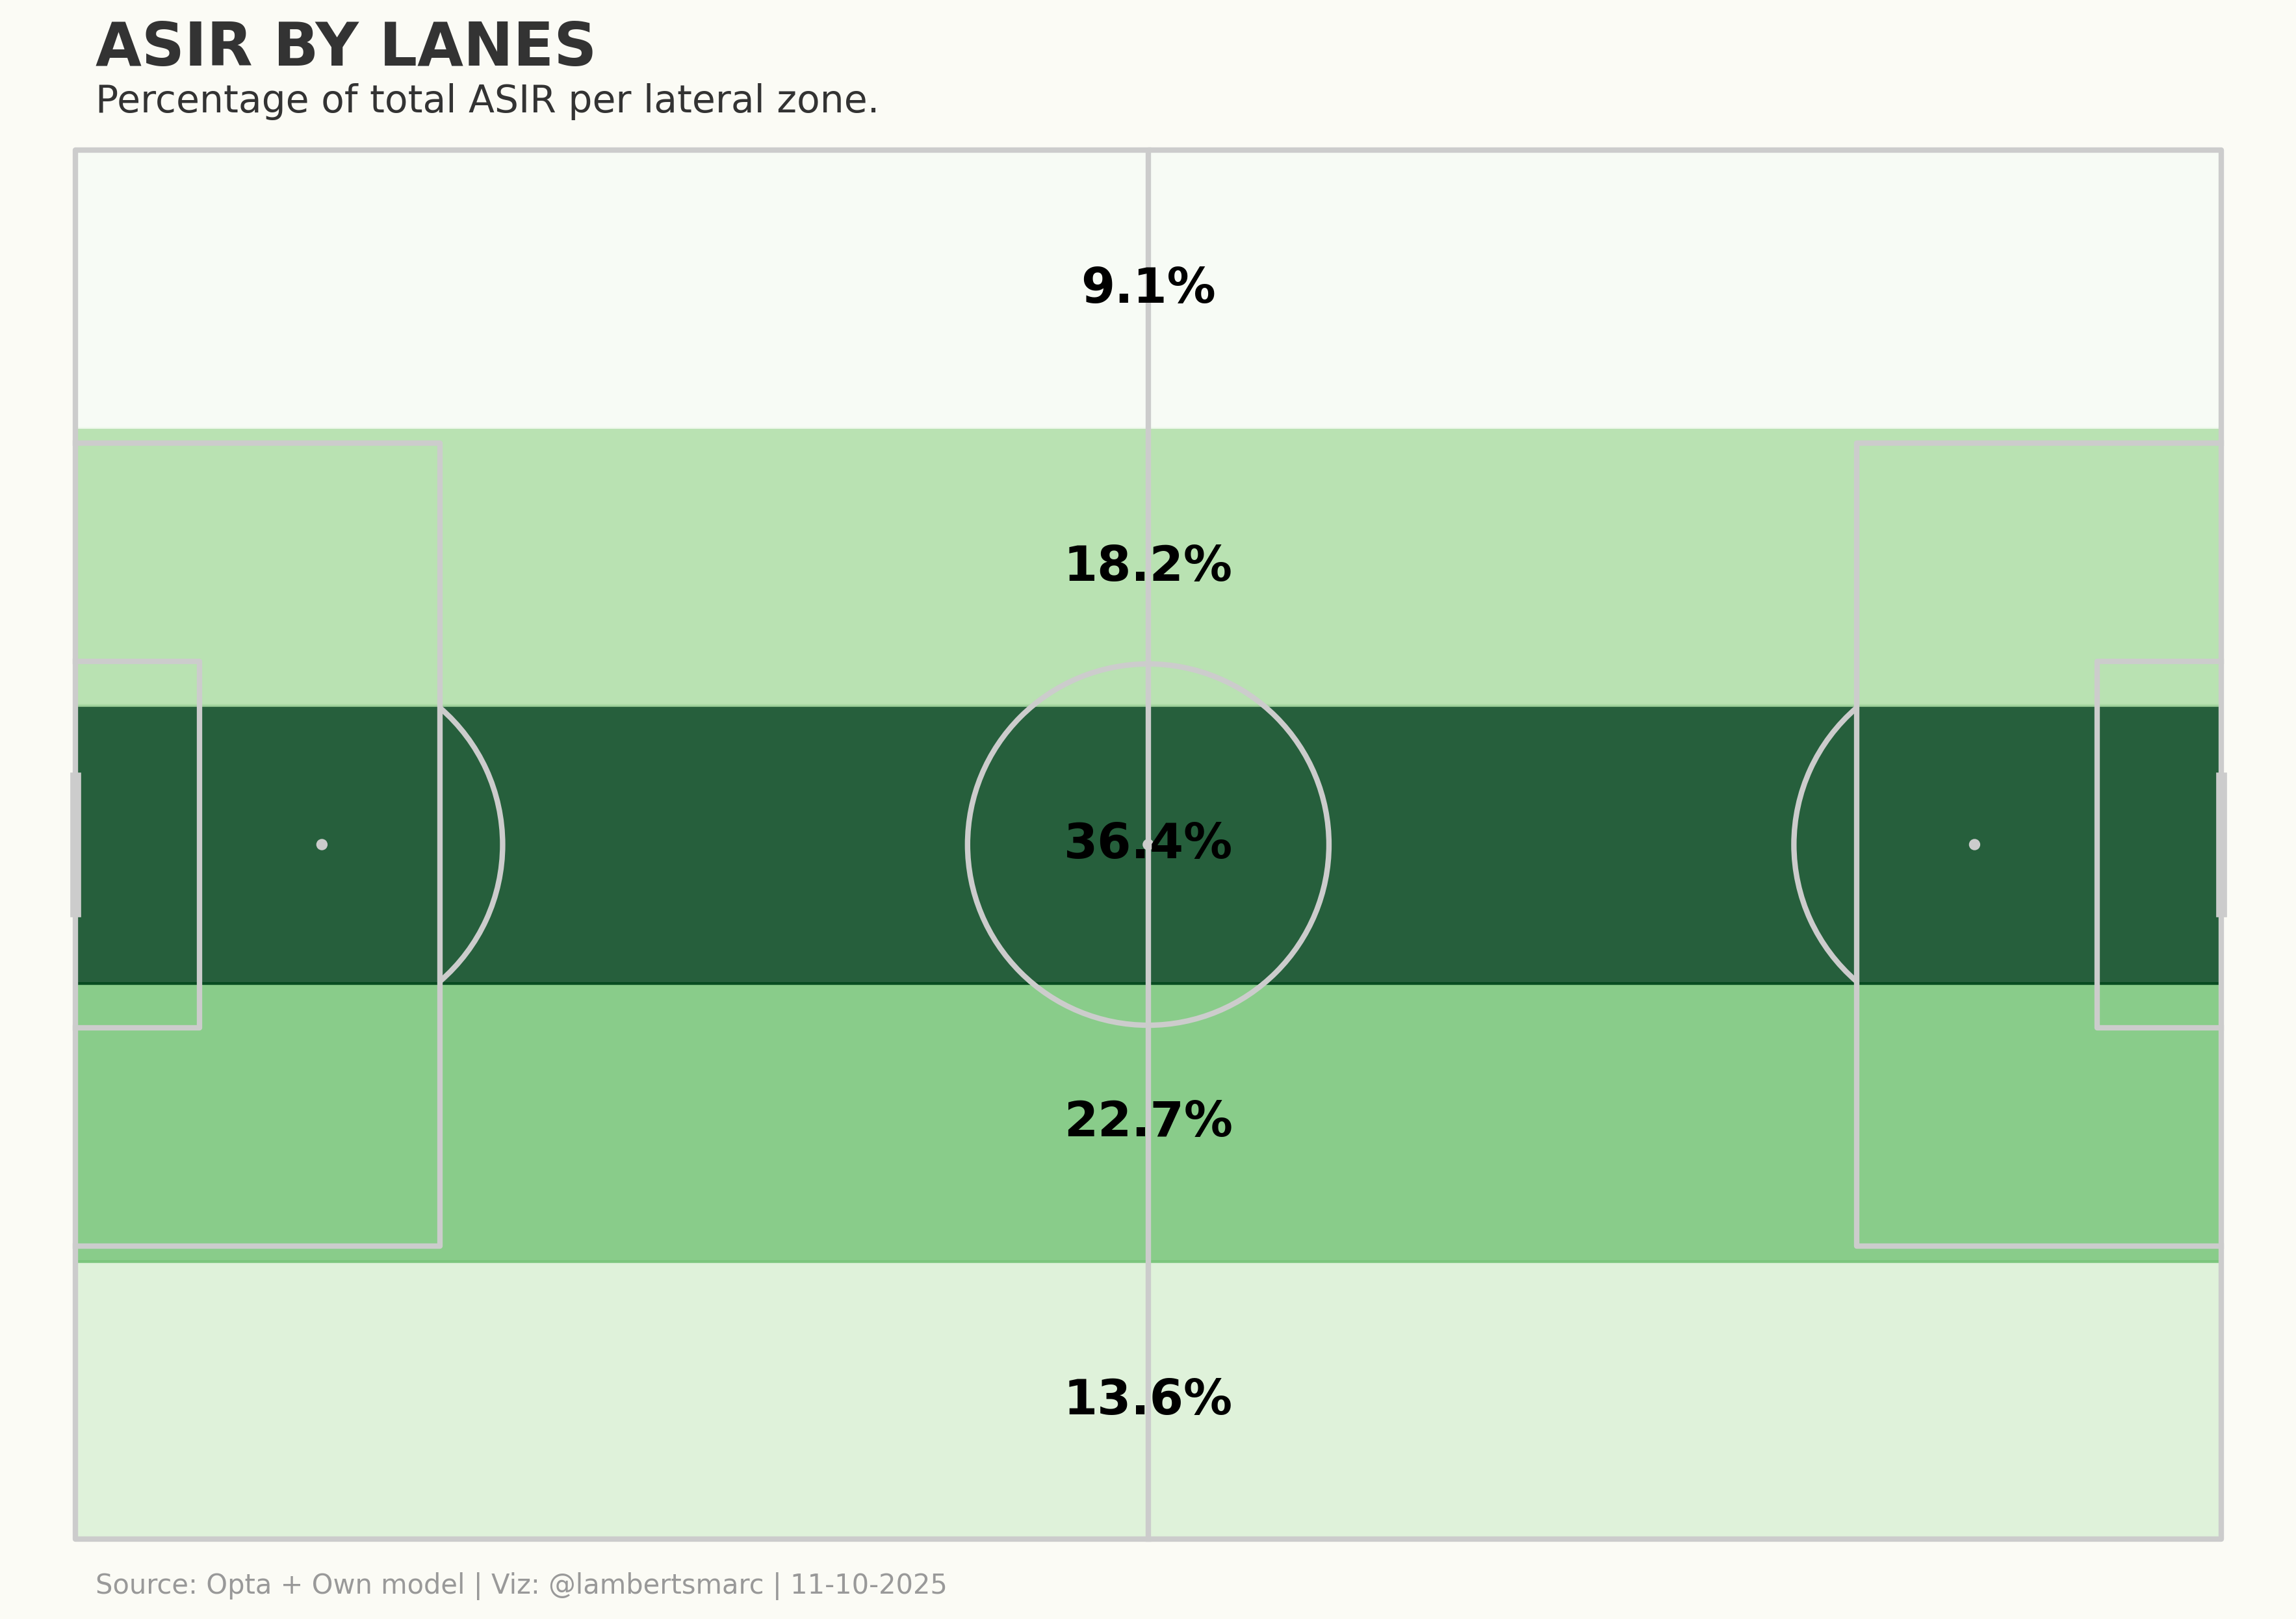
As you can see from the pitch above, for ASIR the highest value comes from the central areas with 36,4% of the ASIR. This is followed by the right half space with 22,7%, the left half space with 18,2%, the right wide area with 13,6% and finally the left wide area with 9,1%.
This gives us a better idea which zones and areas on the pitch are most important for our ASIR-rating and therefore for the qualitative new aerial duels model.So, how does it have a correlation with points per game?
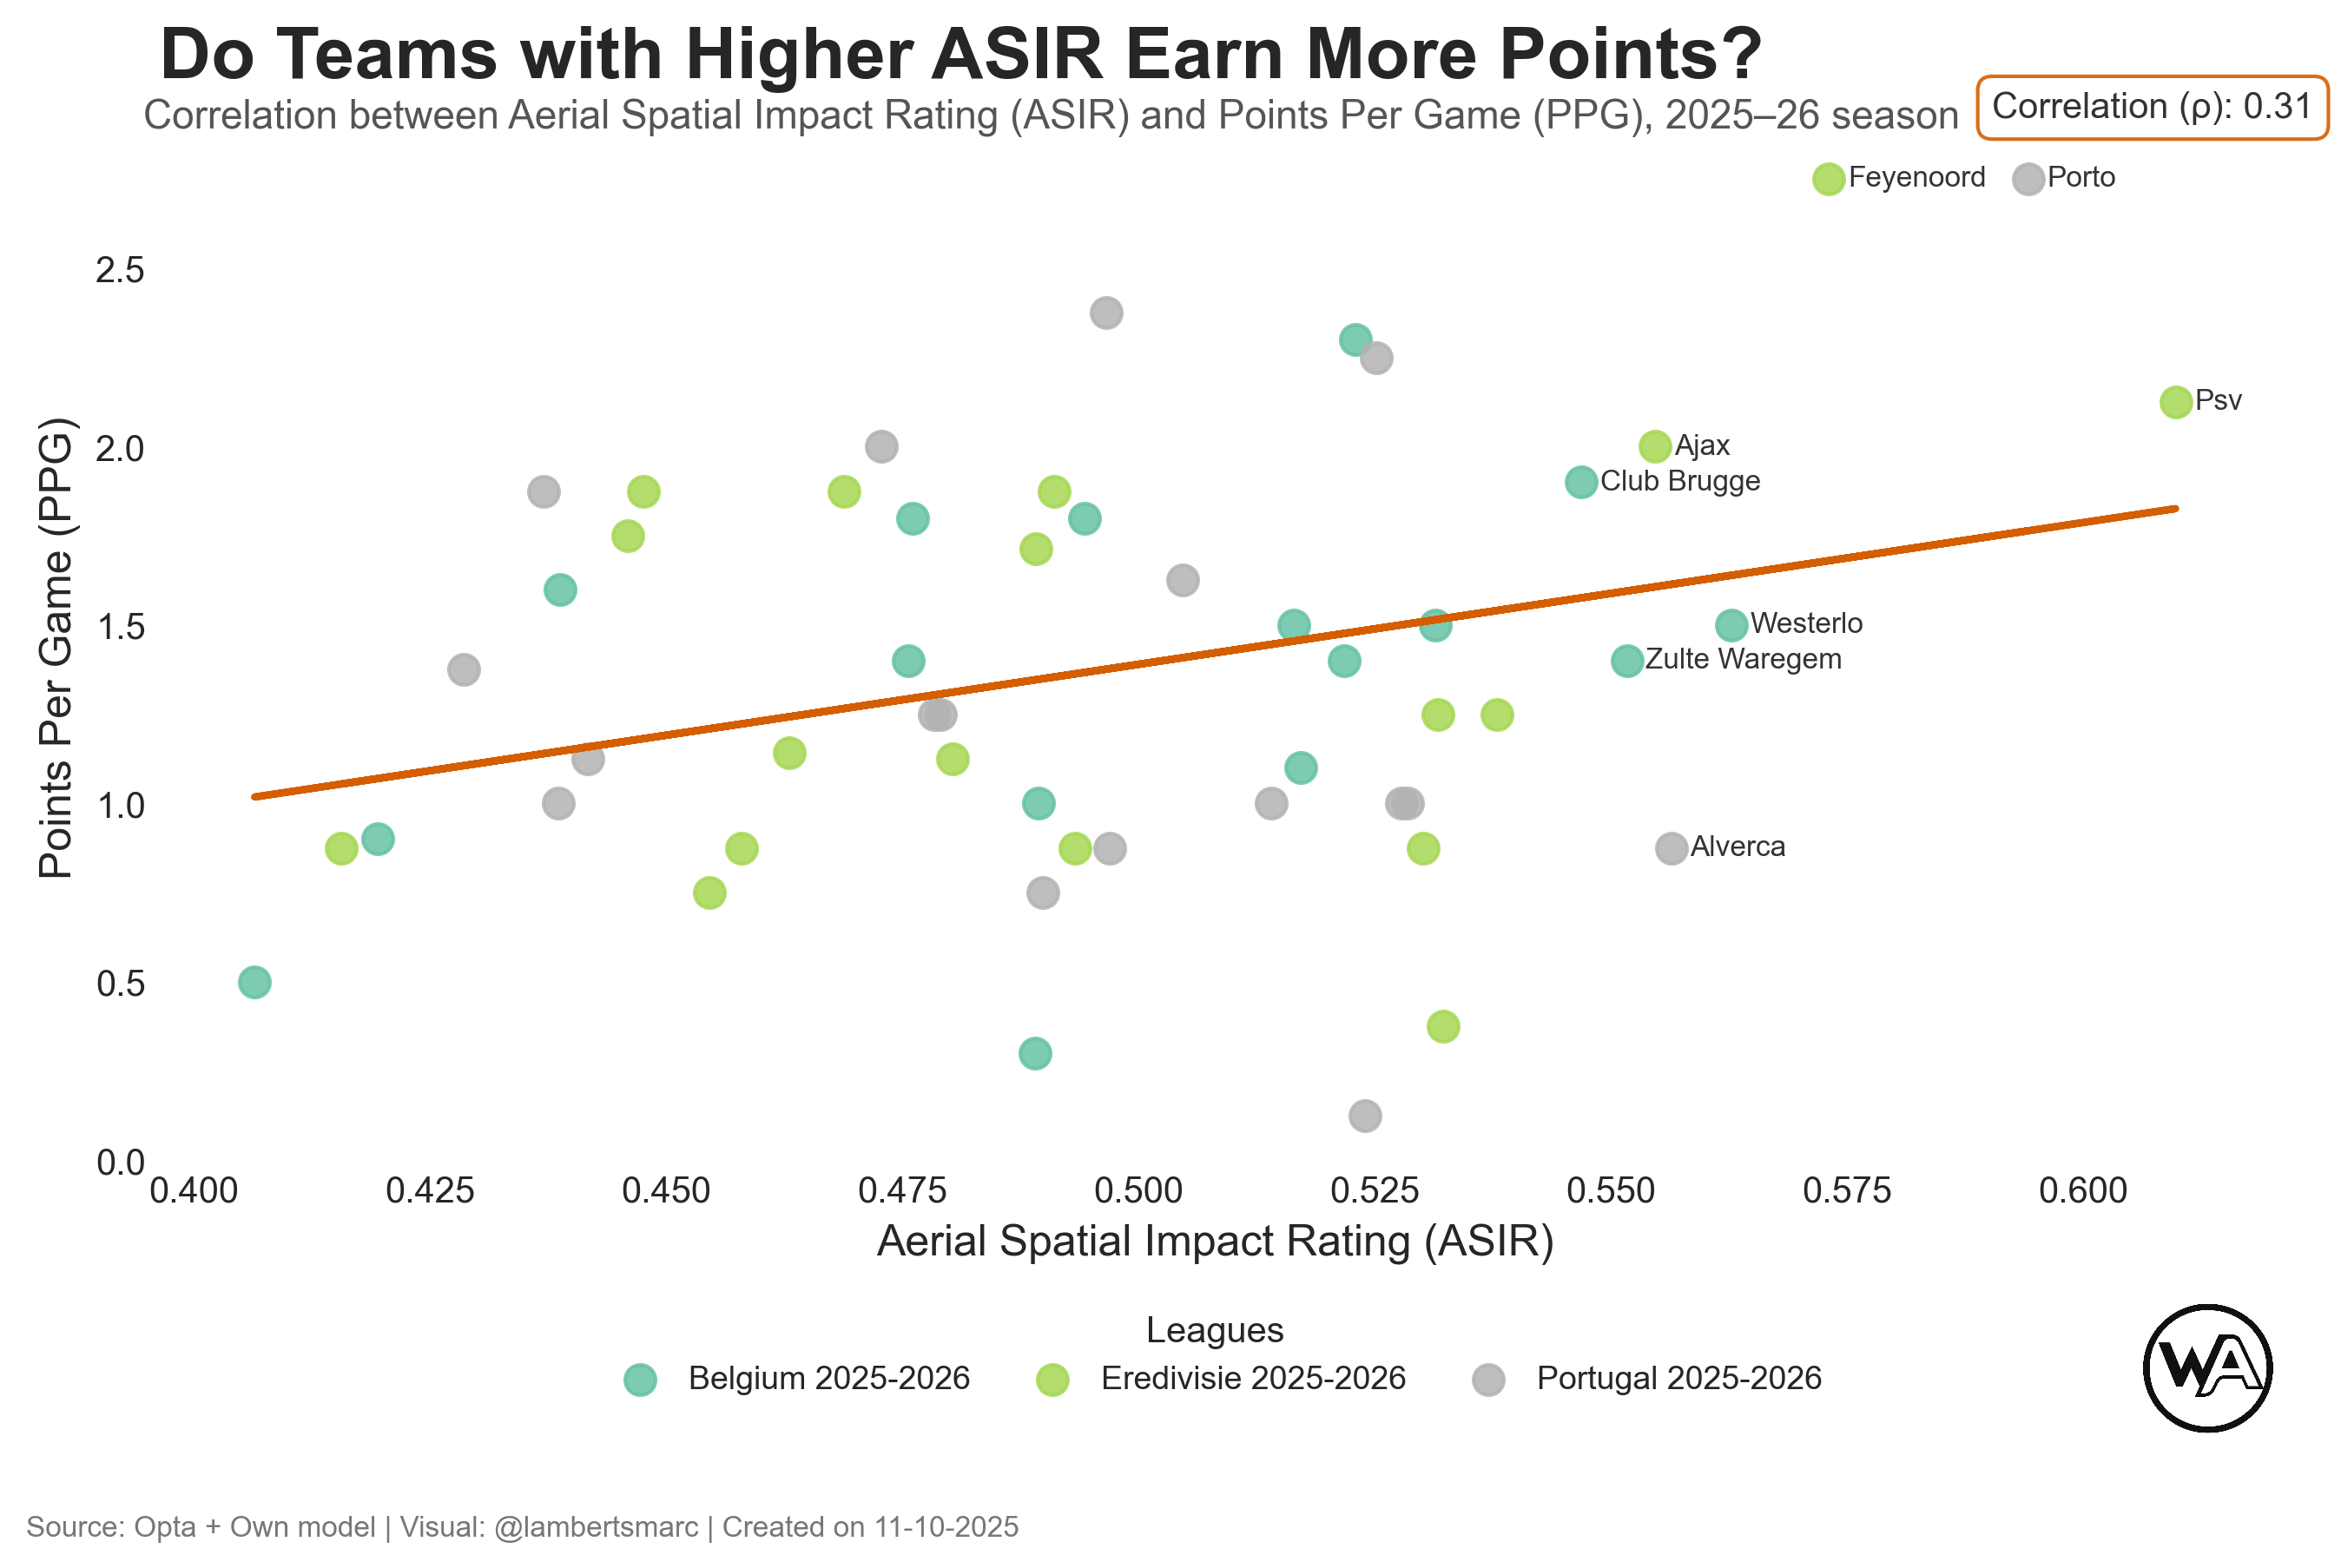
In the scatterplot above we see, ASIR compared to Points per game (PPG). The correlation is 0,31 which 0,05 higher than previous, which indicates that this is a moderate correlation: his means that as one variable increases, the other variable also tends to increase.
This shows the top 15% and the following teams score high in this: Feyenoord, Porto, PSV, Ajax, Club Brugge, Westerlo, Zulte Waregem and Alverca.
Conclusion
This analysis investigates the relationship between Aerial Spatial Impact Rating (ASIR) and Points Per Game (PPG) across multiple European leagues (Netherlands, Belgium, Portugal) during the 2025–26 season.
While ASIR shows a clear positive correlation with team success, the metric alone does not account for all aspects of performance, such as defensive solidity, possession control, or finishing efficiency. Nevertheless, the zonal breakdown provides actionable insight for tactical planning, scouting, and player evaluation.
In the spirit of the discussion — could you share the p-value for the R = 0.26 correlation between aerial duels and points per game? 0.26 is "fairly good" in randomness of football data.
Adding to the discussion, what exactly qualifies an aerial duel as “won” beyond a shot or a completed pass to a teammate. From an empirical point of view, many teams don’t necessarily aim to win the first aerial contact but rather to secure the “second ball.”
If we were to look at this through tracking data, wouldn’t it be interesting to define a “won duel” as maintaining possession in the 2–3 subsequent touches after the aerial contest?
Thanks for the article — really, really interesting work.
Love passion of writing football subscribed and love interacting and maybe see what I am doing wrong as I am a Leeds united writer but new on here